Get Immediate Results With Data Visualization
Your data is as good as your capacity to convey it. Successful entrepreneurs understand and analyze the data and effectively communicate the story behind those data.
The answer is mostly NO! The simple fact can explain why the human brain processes image 60000 times faster than text, and 90% of information transmitted to the brain is visual.
The human brain can process the image in just 13 milliseconds. Visualizing data with the visualization tools like charts and graphs make things easy to understand. Visualizing your data helps you uncover patterns, correlations, and outliers and communicate insights to company or team.
Also, it can lead to intelligent and data-driven decisions. What is Data visualization? Information and data are represented graphically in data visualization.
Data visualization tools make it simple to examine and comprehend trends, patterns, and outliers in data by including visual components such as charts, graphs, and maps.
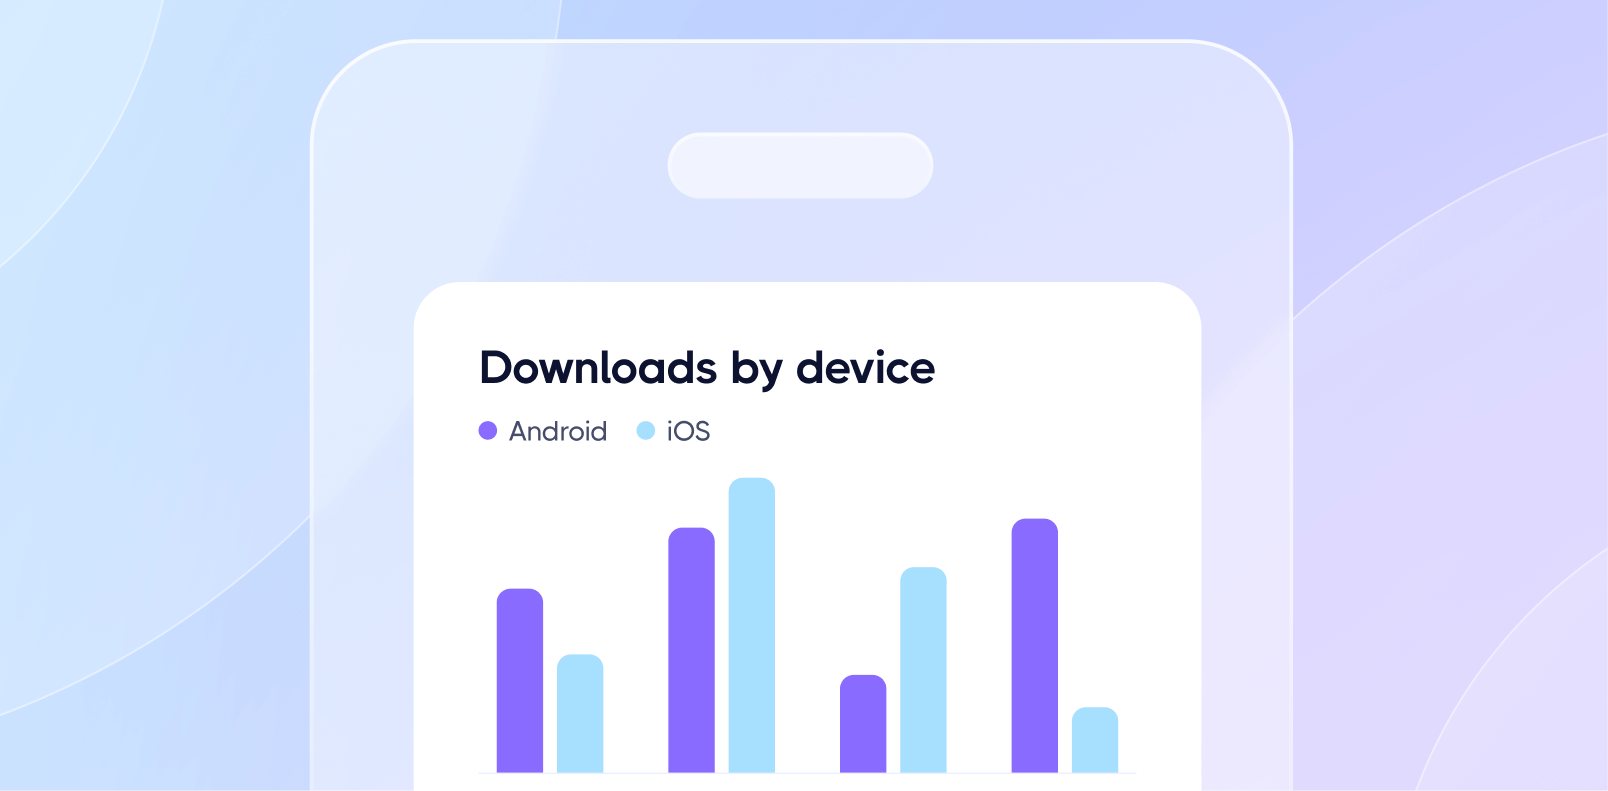
Let us see a simple example of what we have conveyed just now:
The table below shows the sales data from different Gujarat cities and the profit from the same cities. It is simple data that you will forget as soon as you read it. While here, you must do some mental exercise to gain a few insights, the same thing can be done quickly with visual representation.
Sales in different cities of Gujarat Ahmedabad 3M, Vadodara 1.2M, Surat 5.5M, Rajkot 2.7M Ahmedabad
2,40,000, Vadodara 1,20,000, Surat 3,85,000, Rajkot 1,35,000/- Now, look at the below representation of the same data with the visualization toolbar chart.
One can here easily look at the data and compare it simultaneously. It is easy to understand the metrics and gain insights. As you can see here, the sales and profit are easy to compare. You can quickly gauge which city is giving more profit and where the deals are more.
You can also quickly point out where the sales are more and in its comparison profit is less.
By analyzing it, the company can work out ways to increase business where the profit percentage is more. It can also focus more on areas where profitability is comparatively high. While data visualization simplifies the understanding of data, there are other benefits that you cannot simply miss!
Benefits of Data Visualization
1. Self-Explanatory
The best thing about the data visualization tool is that it is self-explanatory. Any layperson can understand what it is trying to convey without expert help. Visually presented data are easy to understand and even easier to remember.
The story with visuals helps convey our point and helps reduce the cost too. That is the reason why visual tools are most popular amongst growing businesses.
2. Encourage Audience Engagement
When an audience looks at the visualization tools, it generates curiosity to grasp an insight into that tool. Also, it increases the impact of the message and compels the audience to get involved. Layers of details allow someone to quickly comprehend macro-level insights or explore at the micro level for the area of interest further.
It strengthens the impact of messaging for your audience and presents the data analysis results most persuasively. “Visualization gives answers to questions you didn’t know you had’’ –Ben Schneiderman
3. Encourages Productivity & Sales
Being able to visualize data produces actual results. The time saved by creating reports leads to greater efficiency company-wise. In an Aberdeen report, organizations that use visual tools are 28 percent more likely to find timely information than those who rely solely on compiling and consolidating the reports.
Organizations that have embraced data visualization lead in revenue growth and plan to invest even more in data visualization in upcoming years.
4. Identify Trends
You can identify trends to improve performance using data insights with data visualization. Visualizing movements regularly allows for greater awareness of a company’s core. It also allows to act as per the trends and reverse the negative trends.
Data visualization tools help teams see insights that may have been missed and create an actionable process that leads to an increase in sales. Overall, data visualization tools can help you boost your confidence and clearly show your side of the story, which can be understood easily by any layperson.
Create MIS Reports with Magenta Insights
MIS reports are essential for the effective management of computer networks. Many organizations use MIS reports to format the entire organization, for which a good MIS is a must. It’s important to adopt efficient ways to obtain MIS reports.
Once you get used to using tools like MagentaBi to create your MIS reports, you can obtain such reports regularly and without fail, which will help you stay updated and make important business decisionsIt gives clarity to all stakeholders. And we all can vouch for the fact that the best way to convey a story is by showing it visually.We certainly remember the movie we watched five years back, but do we recall an article that vividly that we read a few months back?
Customer retention is the key
Lorem ipsum dolor sit amet, consectetur adipiscing elit lobortis arcu enim urna adipiscing praesent velit viverra sit semper lorem eu cursus vel hendrerit elementum morbi curabitur etiam nibh justo, lorem aliquet donec sed sit mi dignissim at ante massa mattis.
- Neque sodales ut etiam sit amet nisl purus non tellus orci ac auctor
- Adipiscing elit ut aliquam purus sit amet viverra suspendisse potent
- Mauris commodo quis imperdiet massa tincidunt nunc pulvinar
- Excepteur sint occaecat cupidatat non proident sunt in culpa qui officia
What are the most relevant factors to consider?
Vitae congue eu consequat ac felis placerat vestibulum lectus mauris ultrices cursus sit amet dictum sit amet justo donec enim diam porttitor lacus luctus accumsan tortor posuere praesent tristique magna sit amet purus gravida quis blandit turpis.
Don’t overspend on growth marketing without good retention rates
At risus viverra adipiscing at in tellus integer feugiat nisl pretium fusce id velit ut tortor sagittis orci a scelerisque purus semper eget at lectus urna duis convallis porta nibh venenatis cras sed felis eget neque laoreet suspendisse interdum consectetur libero id faucibus nisl donec pretium vulputate sapien nec sagittis aliquam nunc lobortis mattis aliquam faucibus purus in.
- Neque sodales ut etiam sit amet nisl purus non tellus orci ac auctor
- Adipiscing elit ut aliquam purus sit amet viverra suspendisse potenti
- Mauris commodo quis imperdiet massa tincidunt nunc pulvinar
- Adipiscing elit ut aliquam purus sit amet viverra suspendisse potenti
What’s the ideal customer retention rate?
Nisi quis eleifend quam adipiscing vitae aliquet bibendum enim facilisis gravida neque euismod in pellentesque massa placerat volutpat lacus laoreet non curabitur gravida odio aenean sed adipiscing diam donec adipiscing tristique risus amet est placerat in egestas erat.
“Lorem ipsum dolor sit amet, consectetur adipiscing elit, sed do eiusmod tempor incididunt ut labore et dolore magna aliqua enim ad minim veniam.”
Next steps to increase your customer retention
Eget lorem dolor sed viverra ipsum nunc aliquet bibendum felis donec et odio pellentesque diam volutpat commodo sed egestas aliquam sem fringilla ut morbi tincidunt augue interdum velit euismod eu tincidunt tortor aliquam nulla facilisi aenean sed adipiscing diam donec adipiscing ut lectus arcu bibendum at varius vel pharetra nibh venenatis cras sed felis eget.


Subscribe to our newsletter today!
You'll receive One Metric for Growth (OMG) every week. 1 Actionable Metric that you can implement in your Business.


You'll receive One Metric for Growth (OMG) every week. 1 Actionable Metric that you can implement in your Business.